Night Watchdetection → notification · the whole pathSTATUS // TRACING
From a failed check to your phone, before anyone notices.
Add your sites. DeadWatch runs every check on your schedule, confirms what's actually broken, and pings you on the channel you chose. Here's the whole path — at a glance.
Every alert travels the same route. Each stage is doing a specific job so the signal reaches you and the noise doesn't.
01
Check
Runs each check on schedule
→
02
Ingest
Results collected & stored
→
03
Score
Graded, classified by reason
→
04
Correlate
Incident opened & de-duplicated
→
05
Notify
Email · Slack · Discord · Webhook
→
06
Resolve
Open → ack → resolve
→
07
Publish
Status page reflects it
01 — the watch
Every check runs on your schedule.
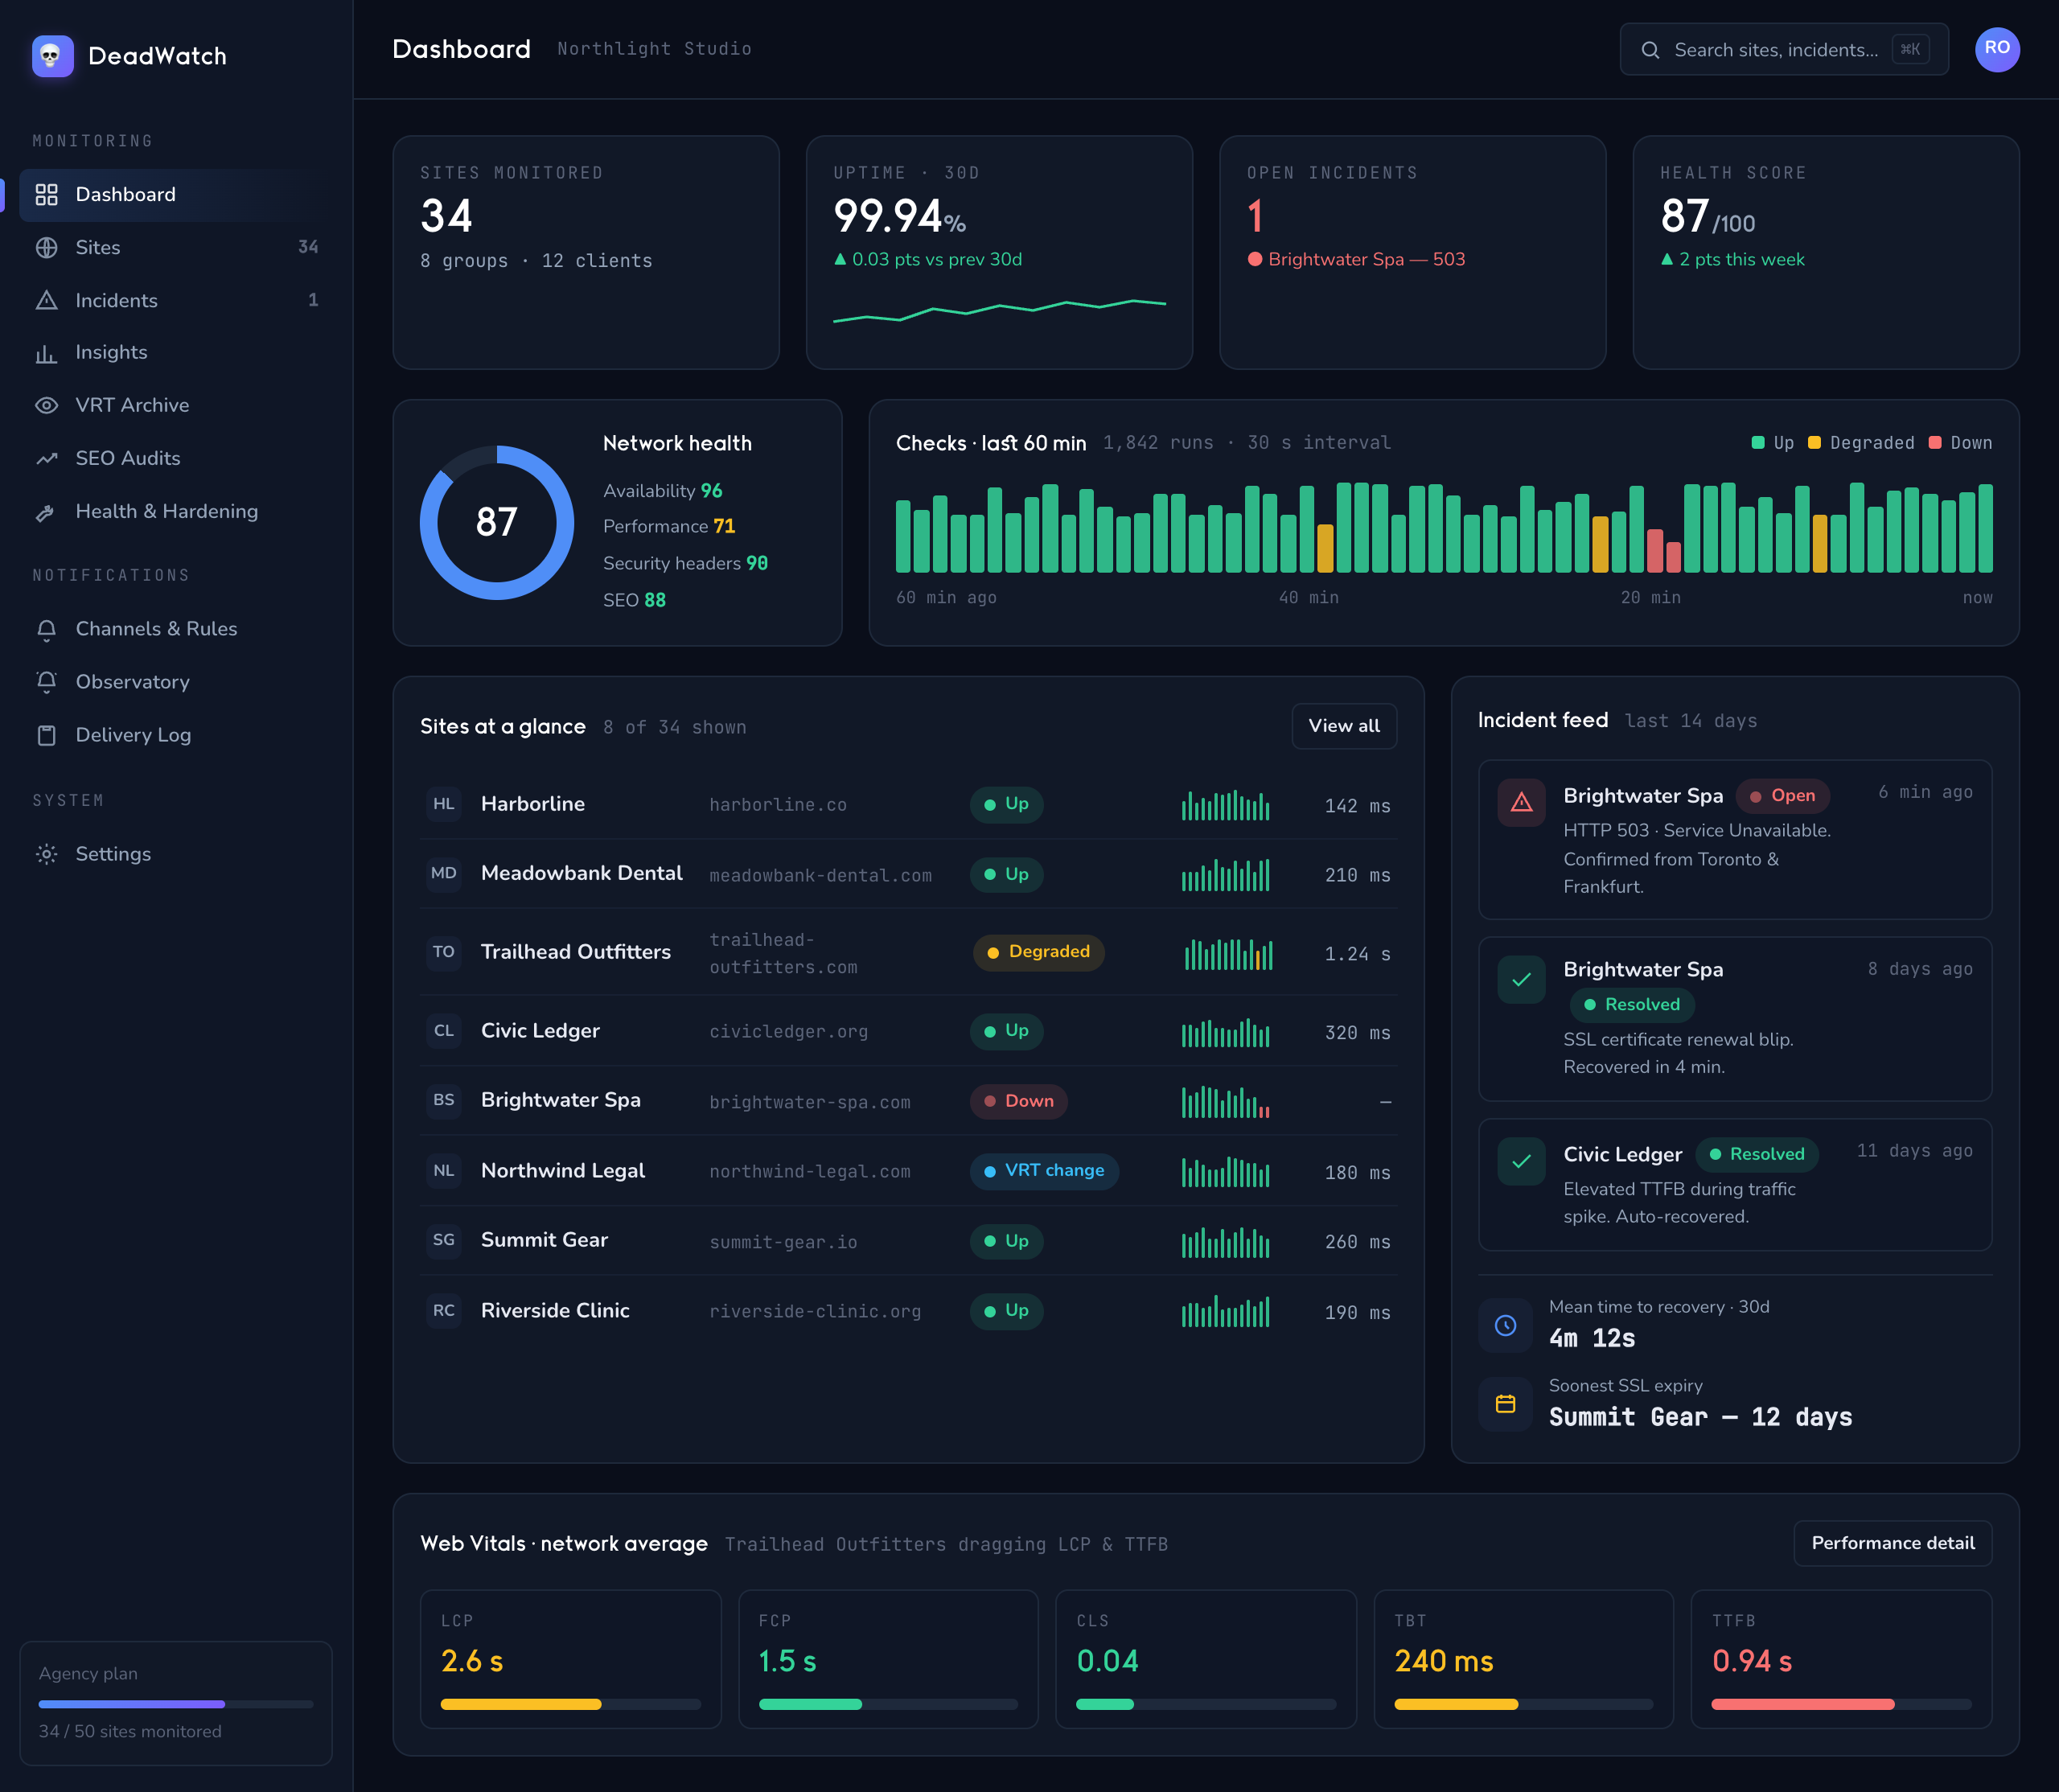
DeadWatch runs each monitor on your schedule — uptime, speed, SSL, DNS, visual changes and the rest — then re-checks to confirm before it pages you. So a single hiccup never gets mistaken for a real outage.
/watch — fleet
One live health picture across every site you watch.
02 — the filter
Only real problems reach you.
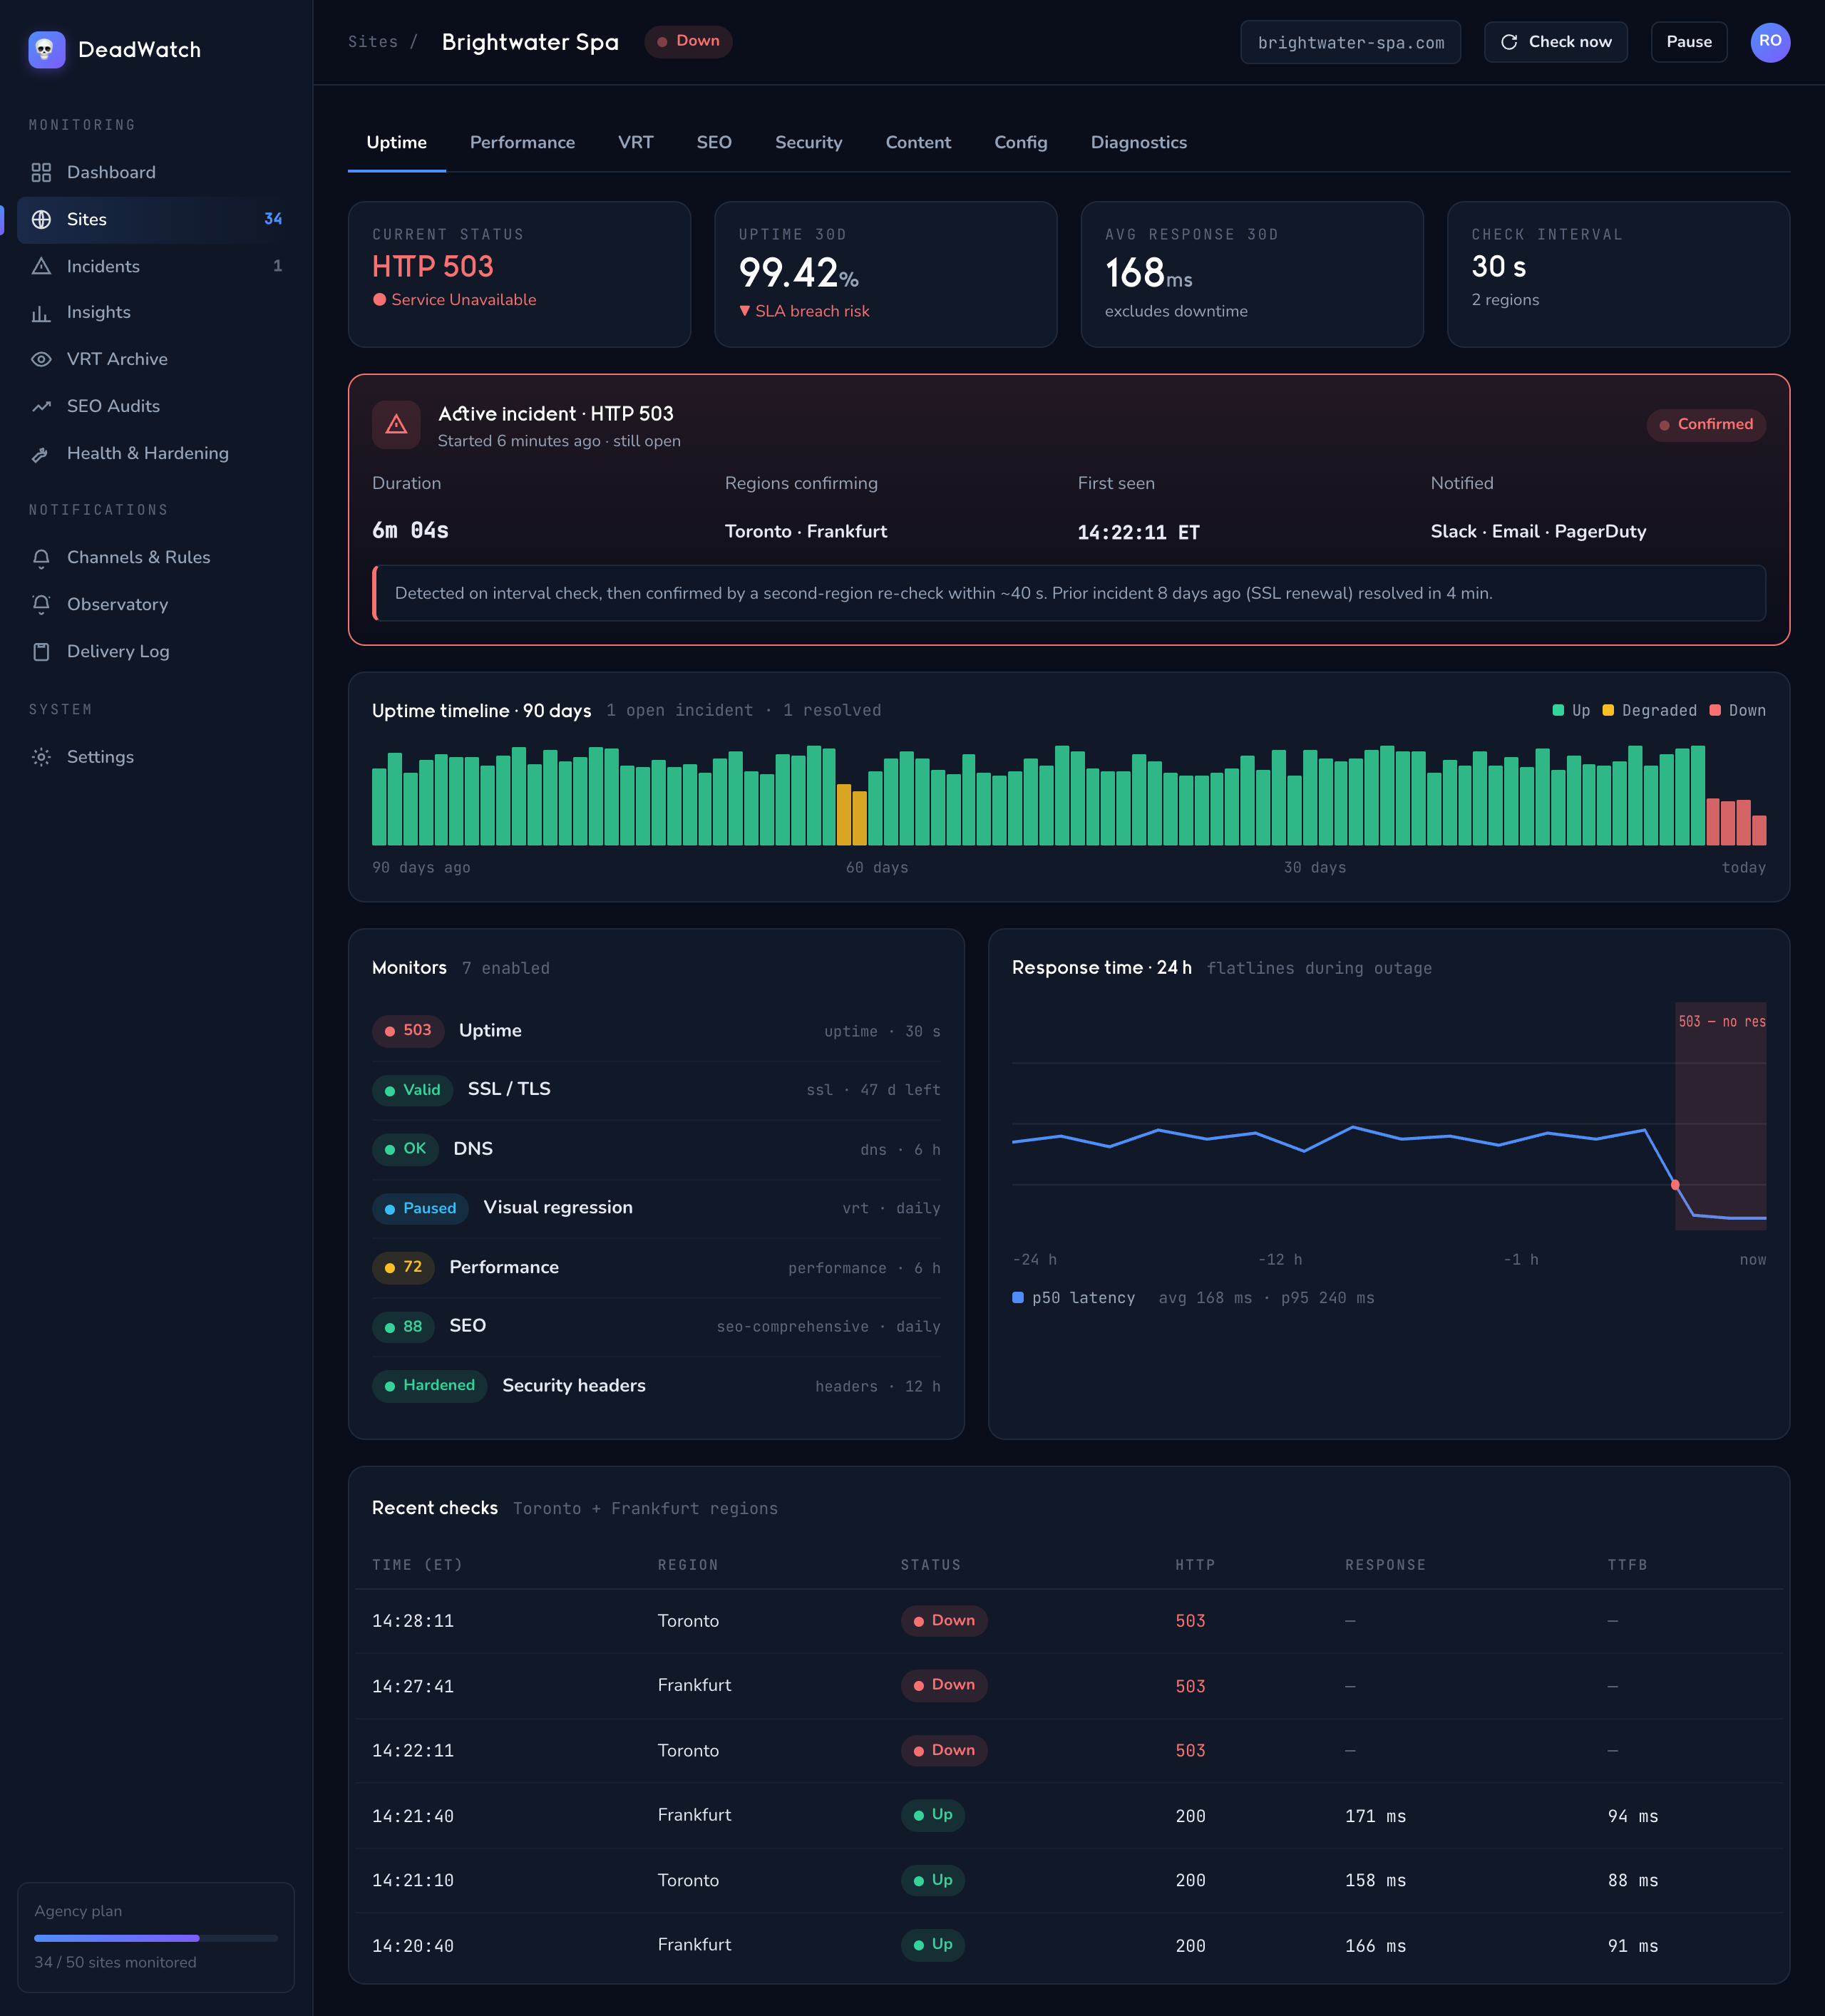
A single blip is ignored. DeadWatch confirms a failure before it pages anyone, folds related failures into one incident — so a big outage is a single alert, not fifty — and quiets a flapping site down to one thing to look at instead of a scroll of noise.
/watch/site — incident
One confirmed incident, timelined — not a wall of duplicate alerts.
03 — the alert
It reaches you on the channel you chose.
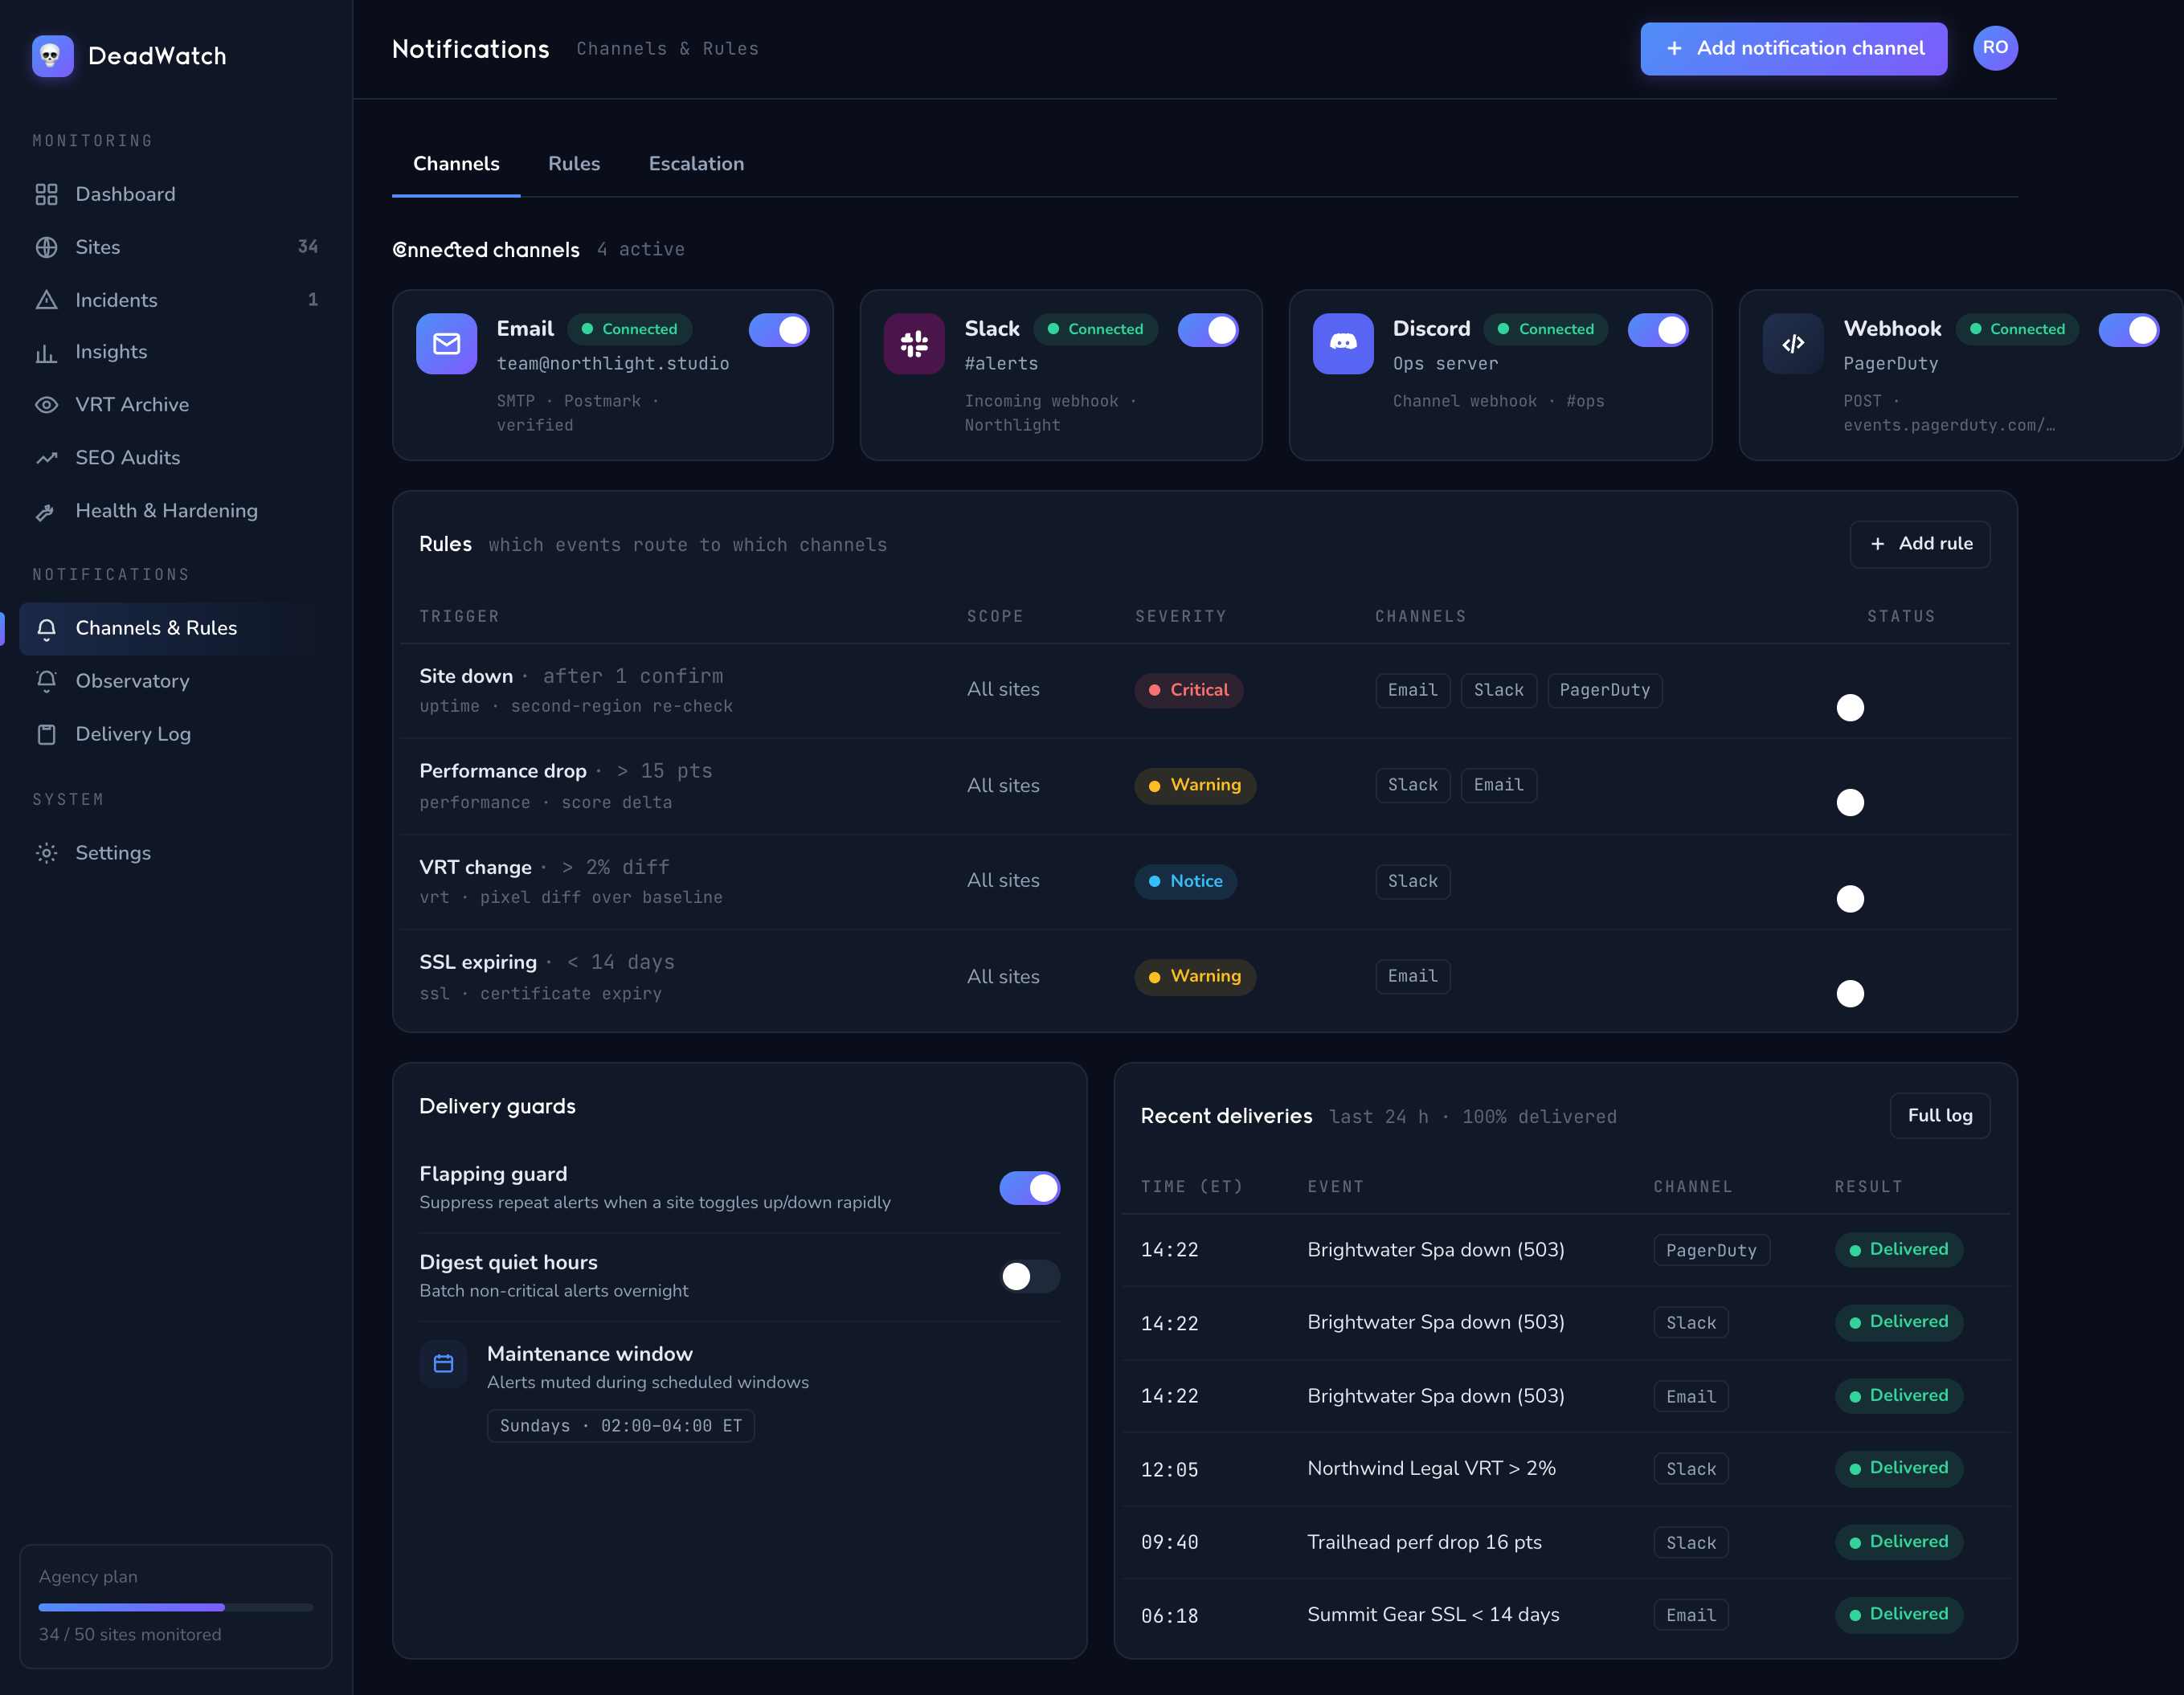
When something real happens, the alert goes where you want it — Email, Slack, Discord, or a webhook into your own tools. Paste a Slack or Discord link and it just works. Route different clients to different places, and trust it to arrive — delivery is durable, so an alert never quietly vanishes.
EmailSlackDiscordGeneric webhook
/watch/notifications
Four channel types, wired how you like — per site or per client.
04 — after the alert
Open, acknowledged, resolved.
Acknowledge an incident and the repeats quiet down while you work it. When the site recovers, DeadWatch marks it resolved. Planned deploy? A maintenance window holds the alerts — the checks keep running, they just don't page.
Stage 1
Open
A confirmed problem opens an incident and the first alert goes out.
Stage 2
Acknowledged
Someone owns it — repeats quiet down while it's worked.
Stage 3
Resolved
Recovery is detected and the incident closes.
05 — stand the watch
Point it at your sites. Watch the pipeline work.
Add a roster and DeadWatch starts running the full path — check, score, correlate, notify — from the first interval. Explore what each stage watches, or start now.