Notifications & incidents
Connect alert channels, route the right events to the right places, tame flapping, schedule maintenance windows, and read incidents and the Triage feed.
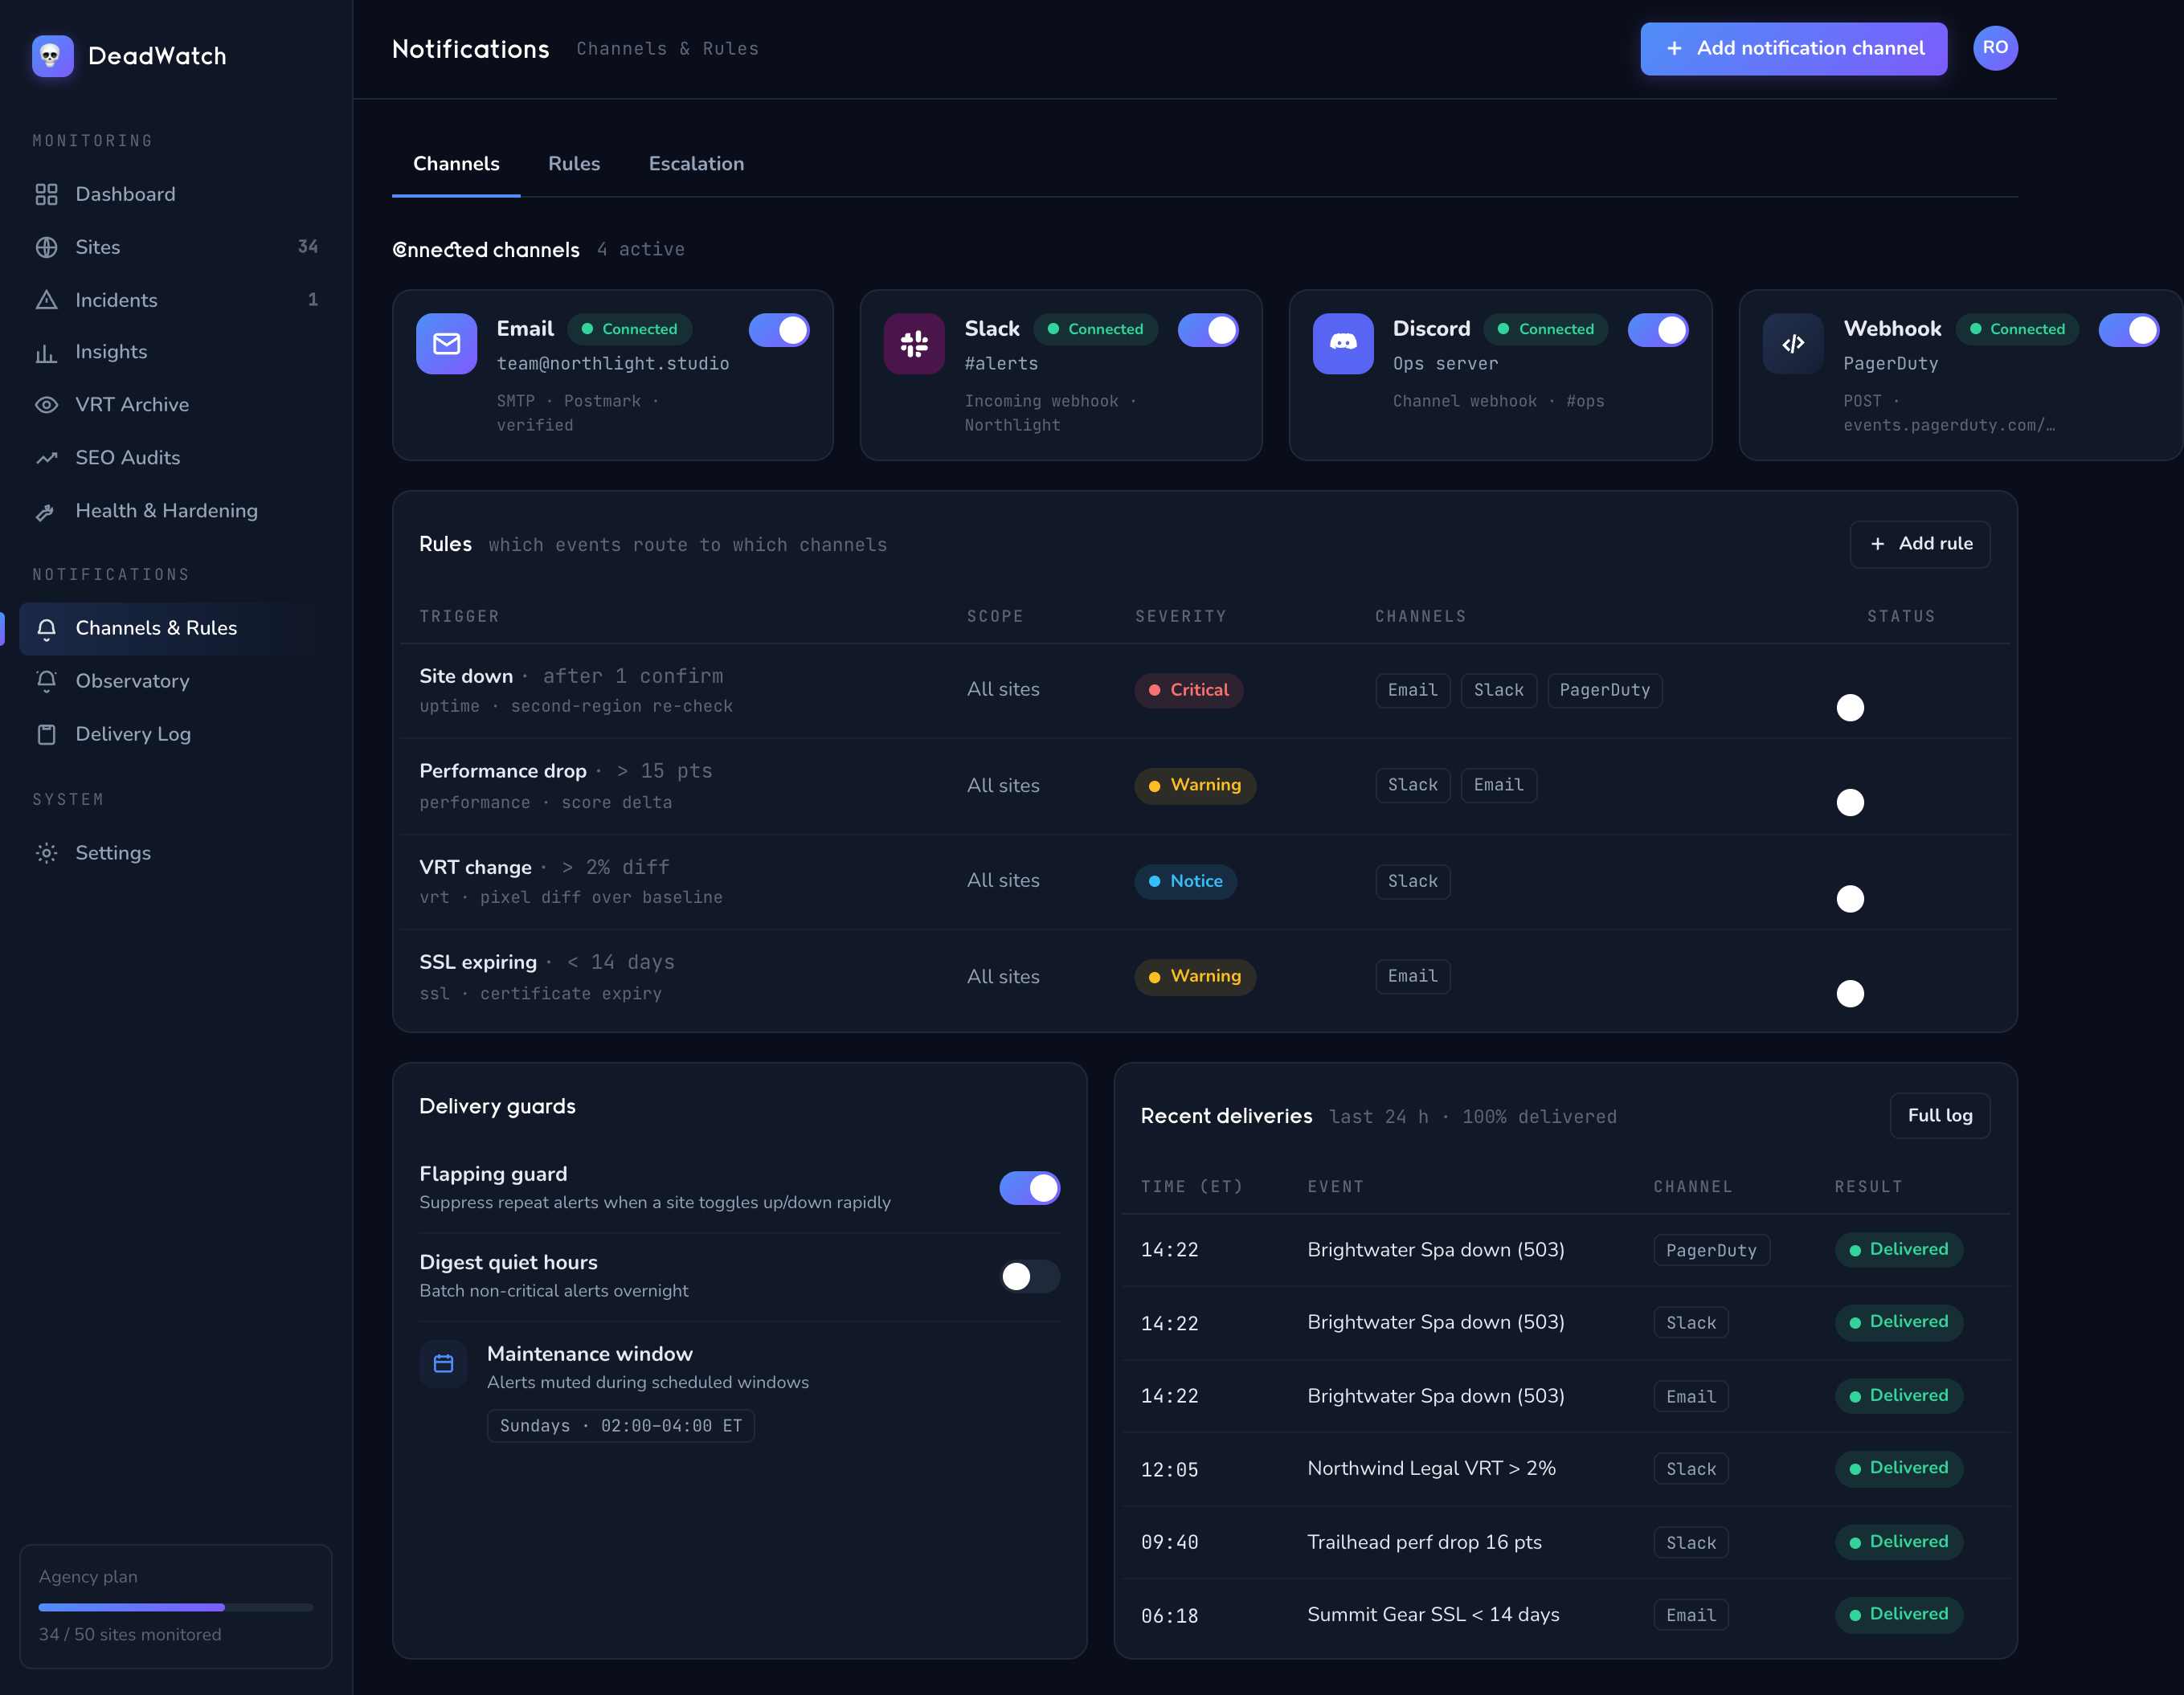
Connect a channel
- Go to Notifications → Channels and click Add notification channel.
- Pick a Type: Email, Slack, Discord, or Webhook.
- Enter the email address or the incoming-webhook URL. For webhooks you can add an optional HMAC Secret (signs the
X-DeadWatch-Signatureheader). - Set a Throttle Window (seconds) — the minimum gap between repeat alerts to this channel (default 300).
- Save, then click the test icon on the channel row.
You'll know it worked when… a test message arrives and the toast reads "Test notification sent — check your channel."
Route alerts with rules
Channels are where; rules are what goes where.
- Go to Notifications → Rules and click Add Rule.
- Choose the Channel.
- Pick Event Types — e.g.
uptime.down,uptime.recovered,ssl.expiring,vrt.changed,perf.degraded,content.drifted,link.broken,domain.expiring,hijacking.detected. - Set a Severity Filter (minor / major / critical) and an optional Site Filter (leave empty for all sites).
- Optionally enable quiet hours with a start/end time and timezone.
- Click Create Rule.
Escalate when nobody responds
If an incident stays open, escalation policies notify more channels over time.
- Go to Notifications → Escalation and click Add Policy.
- Name it and choose the Trigger on events.
- Build Escalation Stages — stage 0 fires Immediate; later stages fire *After N minutes*, each notifying its own channels.
- Save. Open escalations appear in the Active Escalations panel with their current stage.
Flapping protection
When a site rapidly flips UP/DOWN, DeadWatch can suppress the noise instead of paging you on every bounce.
- Globally: Settings → Incidents — toggle Enable flapping suppression and tune the changes threshold, detection window, and stability-to-close.
- Per site: the site's Config tab has flapping/debounce overrides — Min Duration, Clean Passes, Flap Window, and Flap Threshold — for one site only.
Maintenance windows
Doing planned work? Suppress alerts and incidents during the window.
- Go to Maintenance and click to create a Maintenance Window.
- Set the time range, choose the sites, and leave Suppress notifications / Suppress incidents on.
- Optionally make it recurring.
You'll know it worked when… the window shows in the list and alerts stay quiet for its duration.
What an incident is
An incident is DeadWatch grouping a real problem from start to finish:
- Open — the site is DOWN (red). Confirmed by a re-check from a second region, so blips don't page you.
- Acknowledged — you've clicked Acknowledge; the site shows DEGRADED (amber) while you work it.
- Resolved — recovered (green). Until then, Duration reads Ongoing.
On an incident you can Acknowledge, Resolve, Dismiss, or Convert to ticket to open a work item. Filter the Incidents page by status or severity, and switch between Timeline and List views.
Read the Triage feed
Triage (the Triage Queue) is your "what needs attention first" board.
- The top panel — "Hey — we should check these out" — surfaces patterns from the last 30 days that a live status check would miss: Recurring downtime, Silent gap, Flapping, Slow-burn latency. For recurring downtime you can click Schedule Window to open a prefilled maintenance window.
- Below, the feed scores every site by urgency and sorts worst-first — DOWN, SSL expiring, low performance, high drift, broken links, visual changes, DEGRADED — each with Re-check site and Investigate actions.
You'll know it worked when… the feed reads 🎉 All Clear — nothing needs you right now.
Next: Visual regression → to catch the changes that never throw an error.