DeadWatch Monitoring Reference
The canonical list of what DeadWatch actually checks on every site you manage — what each monitor watches, what it measures, the states it reports, and how those roll up into incidents and a single health picture.
DeadWatch is the agency night watch. It reads the vital signs of every client site — not just "is it up," but speed, layout, search, DNS, certificates, and security posture — and pages you the moment one of them drops. This document explains each capability at the reference level: what it is and how to read its output. For step-by-step setup, see the how-to guides.
Every monitor is optional per site. You choose which signals to watch; DeadWatch runs them on a schedule (the site's check interval) and caches the latest result on the site so the board reads instantly.
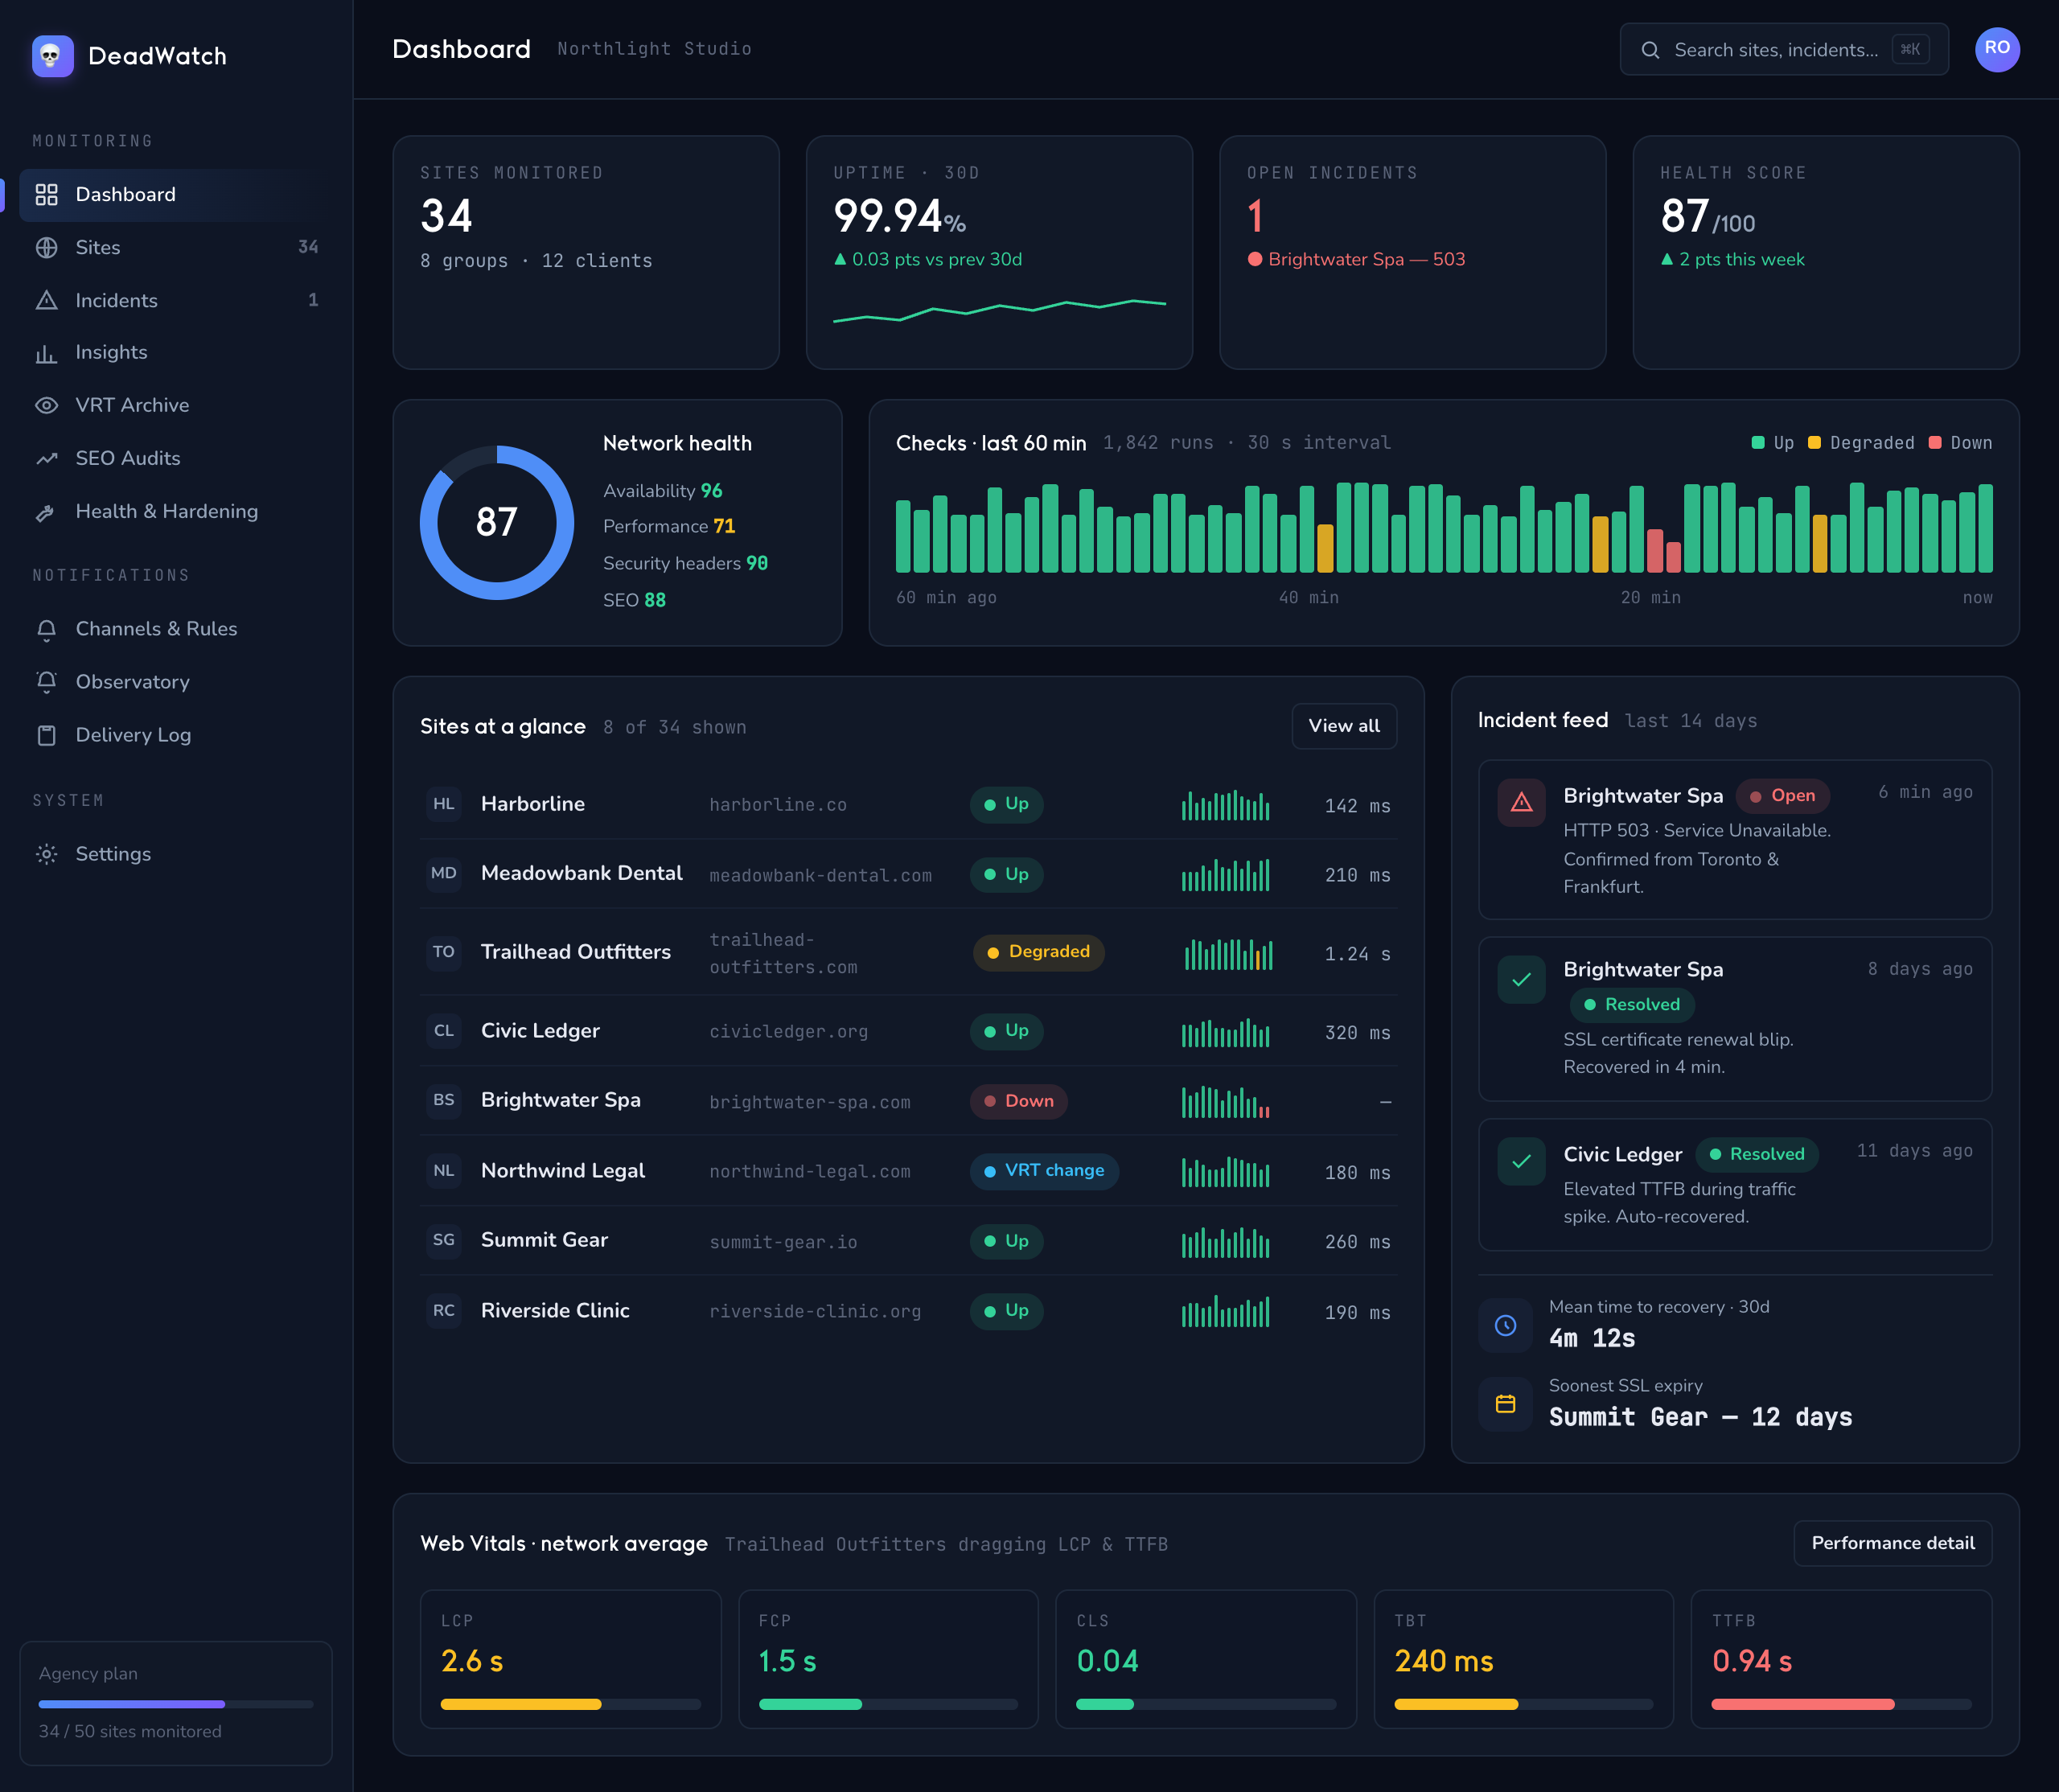
The monitors at a glance
| Monitor | What it watches | Key output | States |
|---|---|---|---|
| Uptime | Reachability and response of the page | Response time, HTTP code, reason code | UP · DEGRADED · DOWN |
| Visual regression (VRT) | The rendered page vs an approved baseline | diff_percent, per-breakpoint | Within baseline · Changed |
| Performance | Web Vitals in a real browser | LCP, FCP, CLS, TBT, TTFB, INP + score/grade | A–F (Fast → Slow) |
| SSL / TLS | The certificate | Days until expiry, issuer, validity | ok · warning · critical |
| DNS | Resolver records | A, AAAA, MX, TXT, NS, CNAME, SOA | ok · critical |
| WHOIS / domain expiry | Registration | Registrar, expiry date, nameservers, status | Tracked / expiring |
| SEO | Robots, sitemap, canonical, on-page | Robots policy, sitemap URLs, page signals | Present / drifted |
| Headers / security | Response-header hardening posture | security_score (CSP, HSTS, XFO, …) | ok · warning · critical |
| Content drift | Structural change in the HTML | drift_score, hash change | success · error |
| Link check | Internal & external links | link_health_score, broken count | healthy · broken |
| Asset change | JS/CSS/image asset fingerprint | asset_score, snapshot hash | success · error |
| Ping / ports | Host reachability and open ports | Reachability, port state | ok · error |
The three heavy, browser-based or long-running monitors — VRT, performance, and SEO (comprehensive), plus content drift — are run asynchronously through the job queue. The rest are lightweight HTTP checks that return inline.
Uptime & incidents
What it watches. Whether the page responds, and how. Every check records a response time, an HTTP status code, and a classified reason code.
How a result is classified. DeadWatch does not treat every non-200 the same way:
- Transport and connection failures (DNS failure, connection refused, timeout, TLS failure) and any
4xx/5xx→ DOWN - A
3xxredirect → UP - A
2xxthat is unusually slow → DEGRADED - A clean
2xx→ UP
Reason codes make the why legible: curl_dns, curl_refused, curl_timeout, curl_ssl, http_401 / http_403 / http_404 / http_429 / http_500 / http_502 / http_503 / http_504, and success_slow.
Site status is one of: UP, DOWN, DEGRADED, UNKNOWN (not yet checked / no signal), PAUSED.
From a failing check to an incident
A single failed check does not page you. DeadWatch confirms first, so a one-off network blip stays quiet while a real outage does not.
| Gate | Default | Meaning |
|---|---|---|
| Confirmation re-check | 2 consecutive DOWN within a 5-minute window | Opens an incident only after the failure is confirmed. An HTTP 5xx is trusted immediately (server-side error, no confirmation needed). |
| Slowness gate | 3 consecutive DEGRADED | A single slow sample won't open a degradation incident. |
| Minimum duration | 45 seconds | Incidents shorter than this auto-resolve and are counted as short outages, not paged. |
| Fast recovery | ≤ 60 seconds | If the site returns UP on the first check and the incident is very young, it resolves immediately. |
| Clean passes to resolve | 2 | Two good checks are required to close an incident under normal recovery. |
| Merge gap | 120 seconds | A recurrence within this gap merges into the prior incident instead of spawning a new one. |
Incident lifecycle. An incident moves through open → acknowledged → resolved. Auto-resolution records why: transient_recovery, clean_passes_met, or a closing state of UP / orphaned / manual.
Severity. major (from a DOWN condition) or minor (from a DEGRADED condition).
Flapping. When a site changes state too often (default: 3+ changes in a 10-minute window), DeadWatch marks it is_flapping and suppresses new incidents while the flap persists — so a thrashing site produces one signal, not a pager storm. All flapping and debounce thresholds cascade per-site → global → default, within clamped bounds.
Maintenance windows. Planned work can be scheduled as one-off or recurring windows, scoped to specific sites or site groups. With incident suppression on, checks still run but no incidents are opened during the window.
Orphan reconciliation. An hourly sweep resolves incidents whose site has been deleted, archived, paused, or has simply stopped being checked — so the board never shows a permanently "open" incident for a site that no longer reports.
Visual regression (VRT)
What it watches. The rendered page. DeadWatch screenshots each monitored URL and compares it, pixel for pixel, against an approved baseline.
What it measures. diff_percent — the share of the page that changed versus baseline. Lower is better. When a baseline exists and a fresh screenshot is captured, the difference is computed and compared against a rolling history (mean + standard deviation) so an anomalous jump stands out from normal noise.
Per breakpoint. VRT runs across device presets (mobile / tablet / desktop viewports), so a change that only breaks on mobile is caught. Results carry diff_percent_by_preset and aggregate to the worst-performing preset. Each result also records its capture mode, color scheme, viewport preset, and the URL path.
States. Within baseline (change below the alert threshold) or Changed (a diff worth your eyes — a shifted layout, a broken header, a third-party script mangling the page).
Reading it. A rising diff_percent after a deploy is the signal that something rendered differently than intended. You approve a new baseline once the change is expected.
Performance & Web Vitals
What it watches. How fast the page loads and settles, measured in a real headless browser.
What it measures. The core Web Vitals and lab timings:
| Metric | Name | Good band (approx.) |
|---|---|---|
| LCP | Largest Contentful Paint | ≤ 1.2s excellent, ≤ 2.5s good |
| FCP | First Contentful Paint | early paint |
| CLS | Cumulative Layout Shift | ≤ 0.05 excellent, ≤ 0.1 good |
| TBT | Total Blocking Time | main-thread blocking |
| TTFB | Time To First Byte | ≤ 200ms excellent, ≤ 800ms good |
| INP | Interaction to Next Paint | responsiveness |
Also computed: TTI (time to interactive), Speed Index, DOM load time, and page weight.
Scoring. DeadWatch computes a 0–100 performance score using Lighthouse-style log-normal scoring, weighted toward the metrics users feel most (LCP, TBT, CLS carry the most weight; FCP and Speed Index less). When a metric is missing, the weights renormalize so the score stays fair.
Grades. The score maps to a letter: A ≥ 90 (Fast), B ≥ 80, C ≥ 50, D ≥ 25, F (Slow). Each metric also gets a per-metric band — Excellent / Good / Needs Improvement / Poor.
Real-user data. Where field data is available (Chrome UX Report / CrUX), DeadWatch surfaces real-user vitals alongside the lab numbers, so you can tell a lab regression from what visitors actually experience.
SSL / TLS
What it watches. The certificate serving the site.
What it measures. days_until_expiry, issuer, valid_from / valid_to, and overall validity.
States. ok, warning (expiring within 30 days), critical (expired or invalid). The certificate-about-to-expire is one of the classic silent failures — the site is up, right until the cert lapses and every visitor hits a browser warning. DeadWatch flags it well ahead.
DNS
What it watches. The domain's resolver records.
What it measures. A, AAAA, MX, TXT, NS, CNAME, SOA (and more) — surfacing A records, MX exchanges with priority, TXT records, and nameservers.
States. ok or critical. A change in these records — an MX that vanished, a nameserver that moved — is often the first sign of a migration gone wrong or a domain takeover.
WHOIS / domain expiry
What it watches. The domain registration itself, RDAP-first with a WHOIS fallback.
What it measures. Registrar, registration and expiry dates, nameservers, and status flags. This is the domain-expiry early-warning: a lapsed domain takes the whole site with it, and the lead time here is measured in weeks, not minutes.
SEO
What it watches. The search-facing signals that quietly tank a site without ever showing an error page.
What it measures. robots.txt (fetched and parsed, including block-all detection), sitemap.xml (discovered, parsed, URLs extracted), and a comprehensive on-page scan across the sitemap URLs — title, description, H1, canonical, Open Graph / Twitter tags, lang, viewport, schema (JSON-LD), and alt-text coverage.
Reading it. Drift is the story here — a canonical that changed, a robots file that suddenly disallows everything, a sitemap that shrank. These don't error; they erode.
Headers & security posture
What it watches. The hardening posture expressed in the site's response headers.
What it measures. A security_score derived from the presence and quality of:
- CSP — Content-Security-Policy
- HSTS — Strict-Transport-Security (including
max-age,includeSubDomains,preload) - X-Frame-Options
- X-Content-Type-Options
- Referrer-Policy
- Permissions-Policy
States. ok / warning / critical, folded into the site's health picture as the Security pillar. This is DeadWatch's header-hardening signal. It works alongside the Hijacking & integrity monitor below; the deeper adversarial probing sold to prospects (file-exposure enumeration, soft-404-controlled discovery) lives in the Kestrel diagnostic — see the Kestrel reference.
Hijacking & integrity
What it watches. Signs that a monitored site has been compromised or quietly altered against the owner's intent — the reputation-wreckers that don't return an error page.
What it measures. A hijacking check that folds into a hijack_state (with hijack_last_at) and a per-site forensics summary — redirect hijacking, cloaking (content served to crawlers differing from users), spam/keyword injection, and hidden-link insertion. The dashboard rolls these into a forensics summary with threat and error counts across the roster, and the site's Security tab surfaces the specific finding.
States. Clean / warning / threat. It fires the hijacking.detected (and related forensics.*) events you can route to any channel. Reading it: an automated hijack/cloaking signal is a strong lead, not a verdict — confirm the specific finding on the Security tab, then treat a confirmed hijack as an incident (rotate credentials, clean the injection).
Content drift
What it watches. Structural change in the page's HTML over time.
What it measures. A normalized fingerprint of the markup — title, H1s, meta description, word count, link counts, image counts — reduced to a SHA-256 hash plus a body-content hash. A change in the hash is drift. Rolls up to a drift_score. (Requires an HTML response; a non-HTML URL reports NOT_HTML.) A richer, browser-rendered drift signal is also available via the comprehensive VRT check.
States. success / error. Reading it: a jump in drift between checks means the page's content or structure changed — intended after a publish, suspicious otherwise.
Link check
What it watches. The links on the page.
What it measures. Extracts links and verifies them (up to 50 internal and 20 external per run, via HEAD/GET). Classifies each as healthy (2xx), broken (4xx), or redirect/error otherwise. Returns the broken count and a slim list of offenders. Rolls up to a link_health_score.
Reading it. A dropping link-health score means broken links accumulated — dead internal pages, an external resource that 404'd — the kind of rot a client notices before you do unless it's watched.
Asset change
What it watches. The JS, CSS, and image assets the page loads.
What it measures. Parses the HTML for asset references (up to 200), dedupes them, and builds a sorted SHA-256 snapshot_hash fingerprint with counts by type. A changed fingerprint means an asset was added, removed, or swapped. Rolls up to an asset_score.
Reading it. New or changed assets between checks flag a deploy, a third-party script injection, or a CDN swap — useful both as a change log and as an early tamper signal.
The health picture
Individual monitors roll up into a single weighted health score per site, so the board reads at a glance. The pillars and their weights (summing to 100):
| Pillar | Weight |
|---|---|
| Availability | 13 |
| SSL | 12 |
| DNS | 10 |
| SEO | 10 |
| Content | 10 |
| Performance | 10 |
| Links | 10 |
| VRT | 10 |
| Security (headers) | 10 |
| Freshness | 5 |
Health status resolves to ok, warning, or critical. Letter grades follow a standard A–F scale (A ≥ 90 … F < 50), with a tighter dedicated table for uptime and a Lighthouse-style table for performance.
Notification channels & routing
When a signal drops, DeadWatch reaches you first. Four channels are supported:
| Channel | Notes |
|---|---|
| Standard email delivery | |
| Slack | Auto-detected from a hooks.slack.com webhook URL |
| Discord | Auto-detected from a discord.com/api/webhooks URL |
| Webhook | Generic JSON POST for anything else |
Routing. Events flow event → router → channel. A routing rule matches on event types (e.g. uptime.down, uptime.recovered, escalation.start) and dispatches to the channels you've configured for that rule. Delivery is durable — queued through an outbox and logged to a delivery log — so a channel being briefly unreachable doesn't lose the alert.
Site organization & teams
Site hierarchy. Sites can be arranged parent → child (parent_site_id), so a primary site and its related properties group together.
Teams. Sites belong to teams. Team members carry a per-team role and permissions; a viewer sees only the sites in their teams — the basis for scoped client access.
Roles. Access control is role-based: super_admin, admin, member, viewer, and api_token. super_admin holds admin capabilities plus exclusive time-mutation rights. Capabilities are granular strings — sites:create/read/update/delete/check, incidents:read/manage, notifications:*, status_page:*, and more — so access can be shaped precisely. Ready-made permission-set templates (Designer, Developer, QA/Tester, DevOps Engineer, Project Manager, …) can be imported as a starting point.
Hosting model. Each agency runs on its own instance at its own subdomain — your data in your own database, never mixed with another agency's. You manage sites; the platform is managed and updated for you.