Getting started
From zero to "you're watching": sign in, confirm the connection, add your first site, choose what to monitor, wire up an alert, and see your first incident.
DeadWatch is the agency night watch — it reads the vital signs of every site you manage and pages you the moment one flatlines. This guide gets your first site under watch in a few minutes.
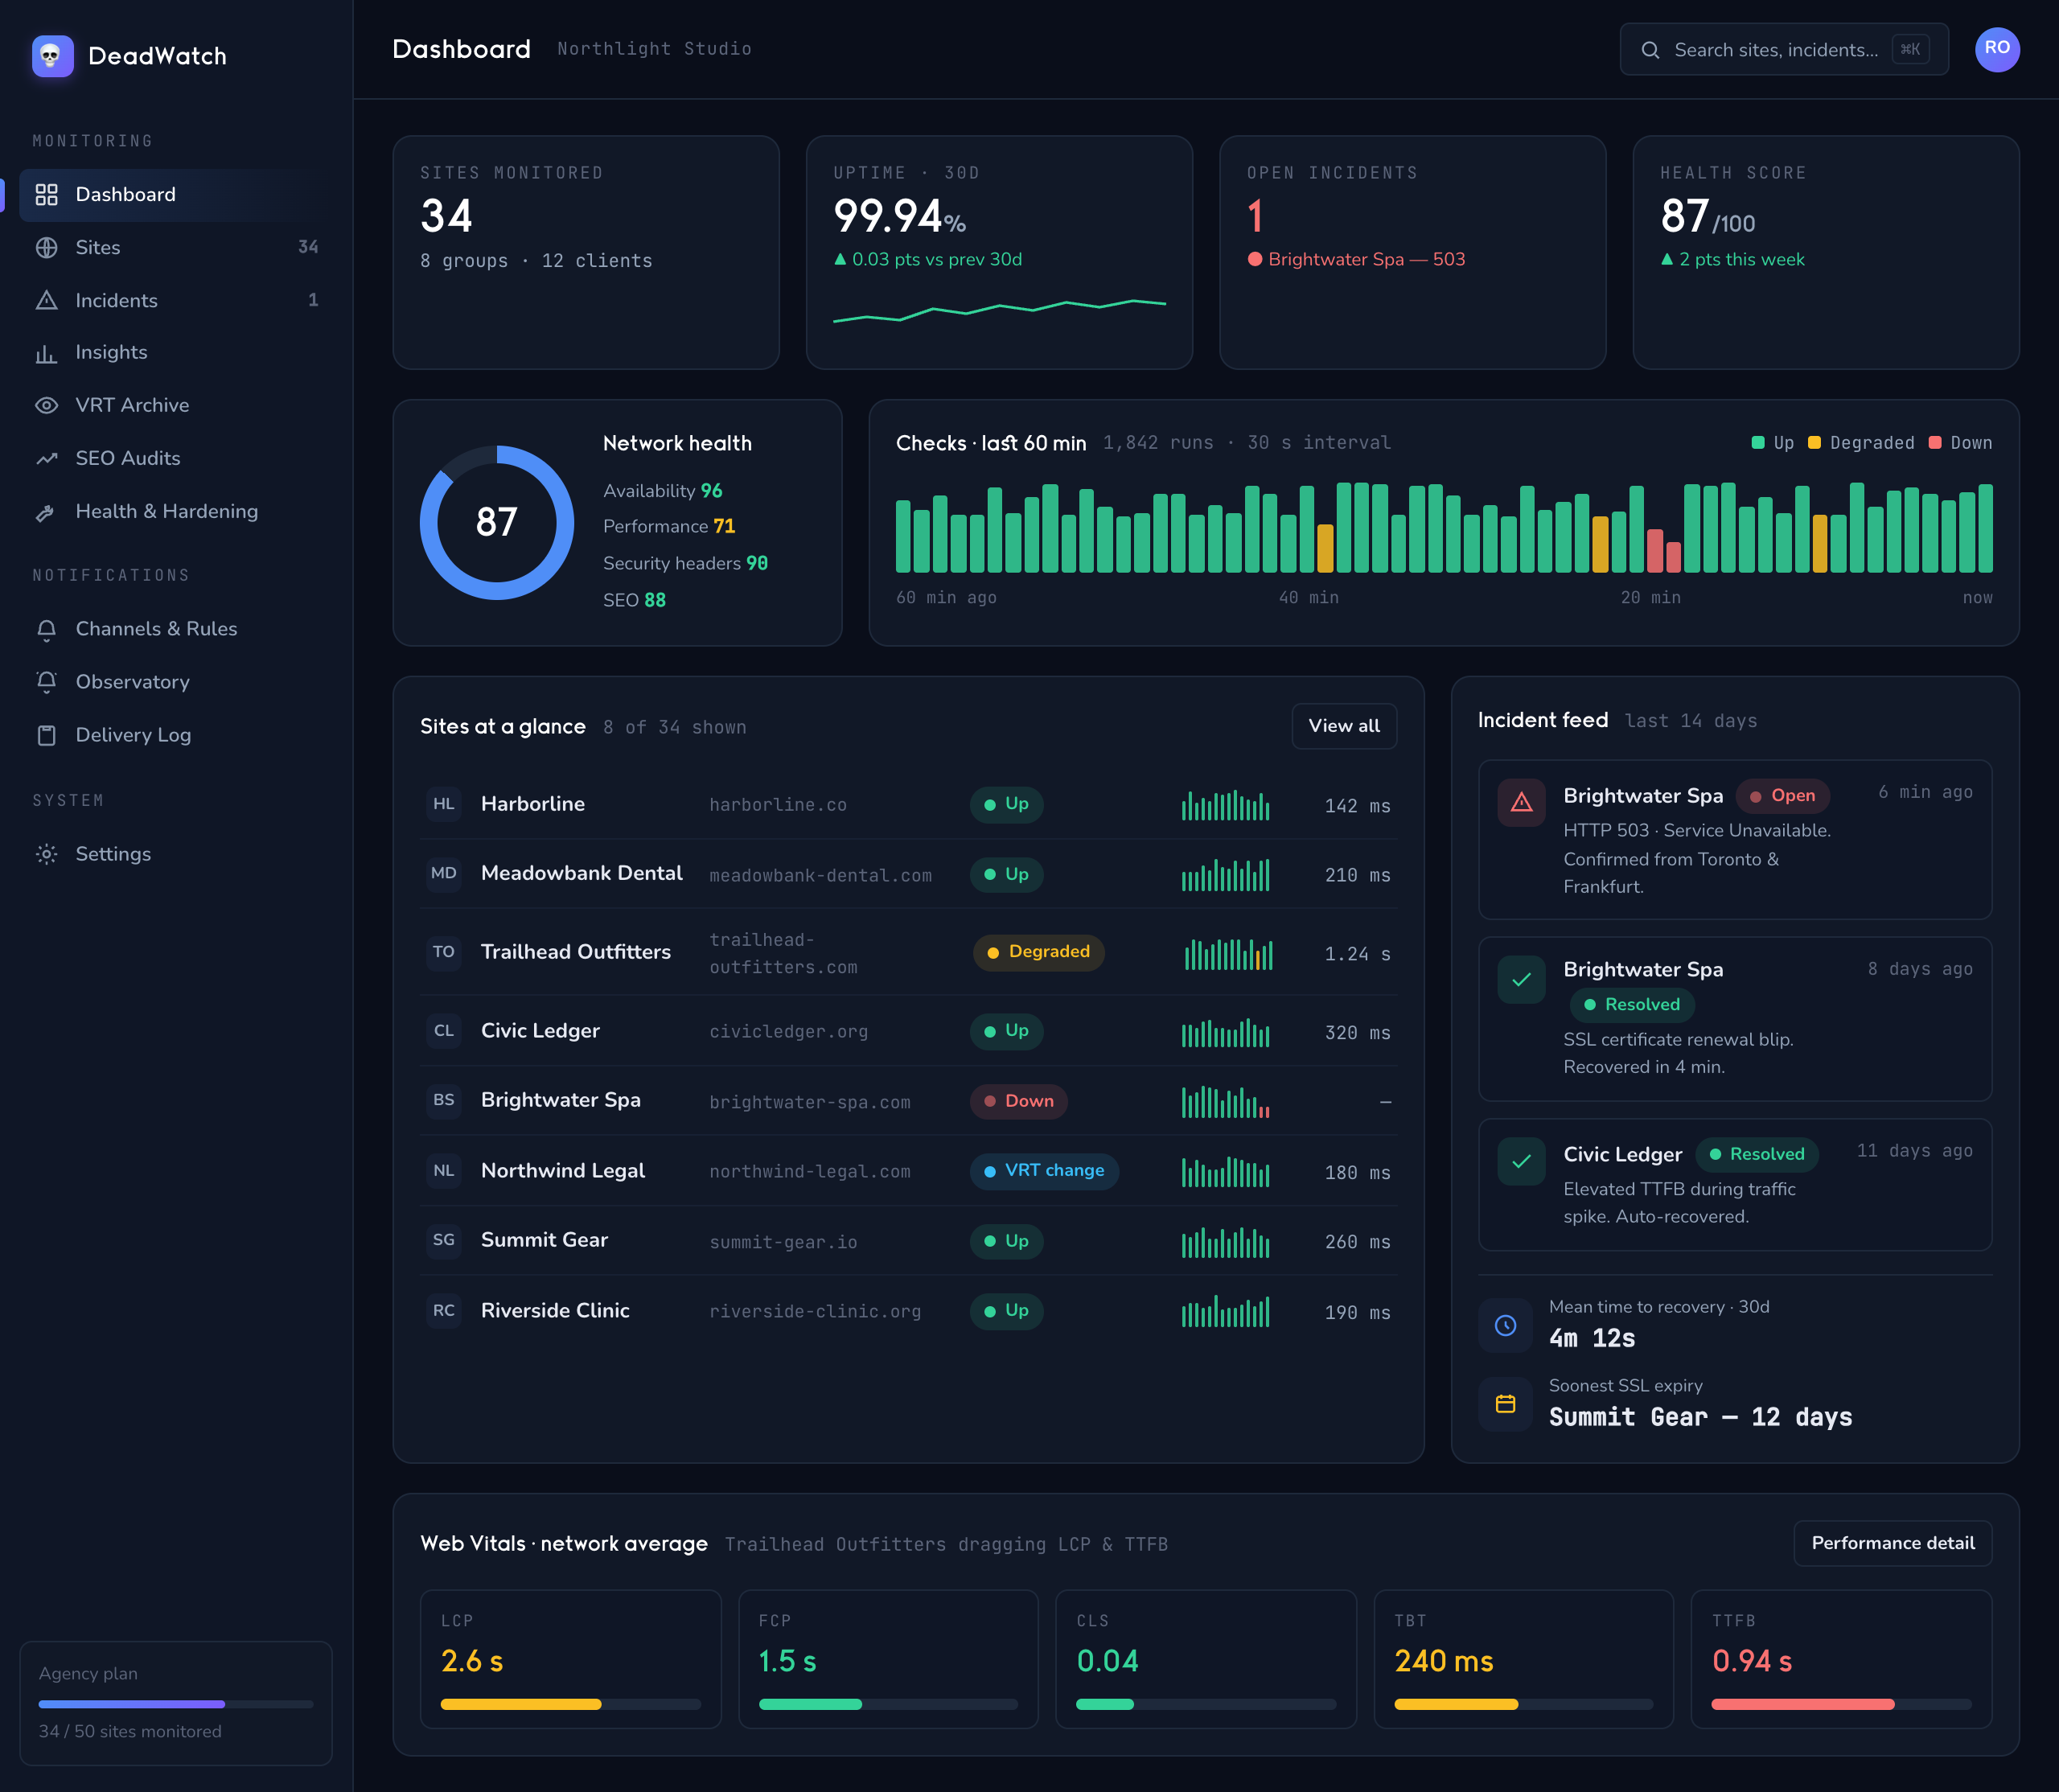
1. Sign in
- Open your DeadWatch instance (your own subdomain — your data, never mixed with another agency's).
- Sign in with the email and password from your invite, or use the magic link login to get a one-time sign-in email.
You'll know it worked when… you land on the Dashboard with the sidebar visible.
2. Confirm the connection
DeadWatch runs its checks through an orchestration API. Make sure your instance is talking to it before you add sites.
- Go to Settings → API Connectivity.
- Click Test Connection.
- Look for the green Connected & Authenticated banner. If you see Reachable — Auth Failed, your API key needs fixing — check the API Key field in the same section.
You'll know it worked when… the banner reads Connected & Authenticated and the Poller Status shows Running.
3. Add your first site
- Go to Sites and click Add Site.
- Enter the Domain (e.g.
example.com) and an optional Label. - Under Monitors, pick what to watch. New sites default to uptime, ssl, and dns — toggle on more (like performance, vrt, seo-comprehensive, headers, or wordpress) by clicking the pills.
- Optionally add Tags (type a tag, press Enter) and assign a Client or Team.
- Click Add Site.
You'll know it worked when… the site appears on the Sites board with a status dot, and a toast reads "example.com added." A brand-new site shows Unknown until its first check lands (usually within a minute or two).
4. Connect an alert channel
An alert is only useful if it reaches you. Wire up where DeadWatch should page you.
- Go to Notifications → Channels and click Add notification channel.
- Choose a Type: Email, Slack, Discord, or Webhook.
- Enter the address or webhook URL (e.g. a Slack incoming-webhook URL).
- Save, then click the test (paper-plane) icon on the channel.
You'll know it worked when… a test alert lands in your inbox / Slack / Discord and the toast reads "Test notification sent — check your channel."
5. See your first incident
When a monitored site goes DOWN or DEGRADED, DeadWatch opens an incident — and, thanks to a confirmation re-check from a second region, a one-off blip won't wake you but a real outage will.
- Go to Incidents to see the live feed (default Timeline view).
- Click any incident to open it — you'll see its Status (open / acknowledged / resolved), Cause, and a live Duration that reads Ongoing until it recovers.
- Click Acknowledge to signal you're on it, or Resolve when it's fixed.
You'll know it worked when… a DOWN site produces an incident row, your connected channel fires, and you knew before your client did. That's the watch.
Next: Add & organize sites → to bring your whole roster on board.